一、安装xdebug
下载Xdebug,要下载与PHP对应版本的Xdebug
xdebug官网下载地址:Xdebug: Downloads 这里下载的如果没有跟你的php对应,那么等待你的就是一堆报错
网站提供了一个自动分析系统对应的xdebug版本 ,网址是:
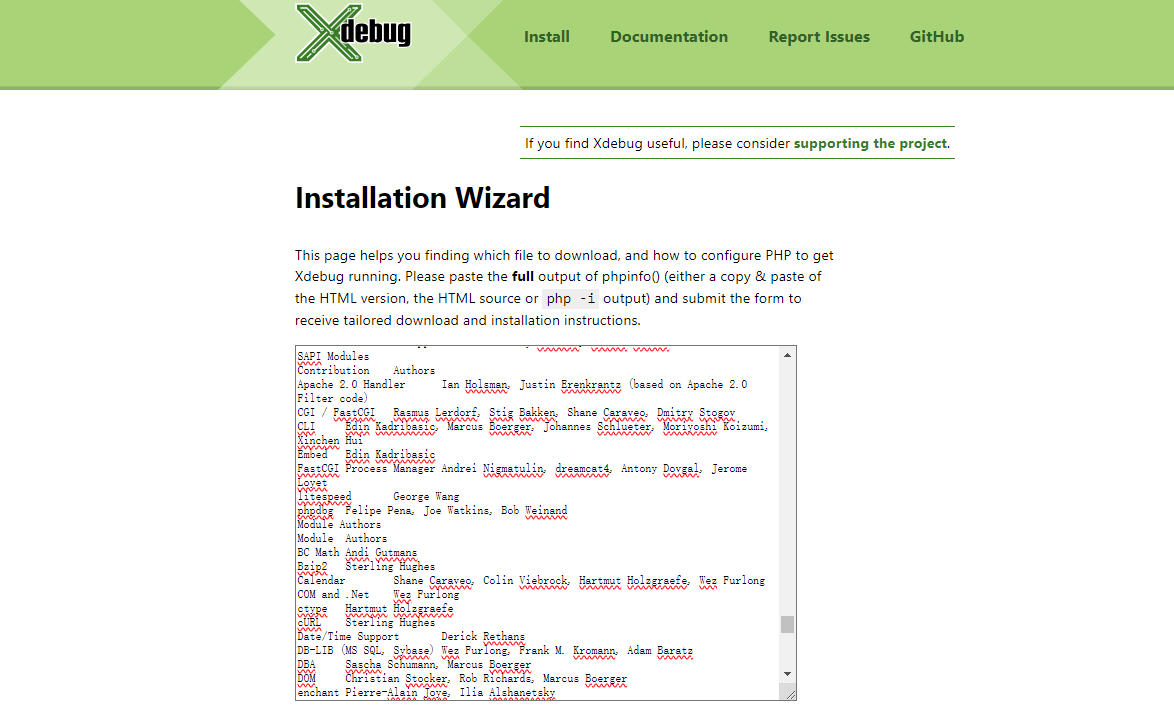
Xdebug: Support — Tailored Installation Instructions
在页面中需要粘贴进去php版本信息,也就是phpinfo()的信息
<?php phpinfo();?>

ctrl+A全选这个页面的信息,然后粘贴到Xdebug: Support — Tailored Installation Instructions里
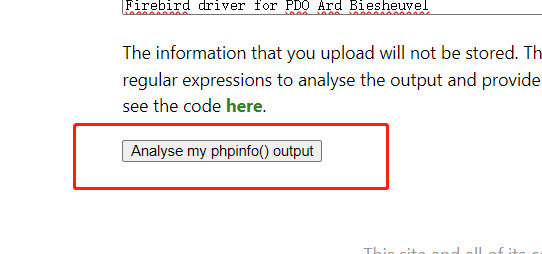
点击这个按钮:
就可以看到对应你版本的xdebug下载
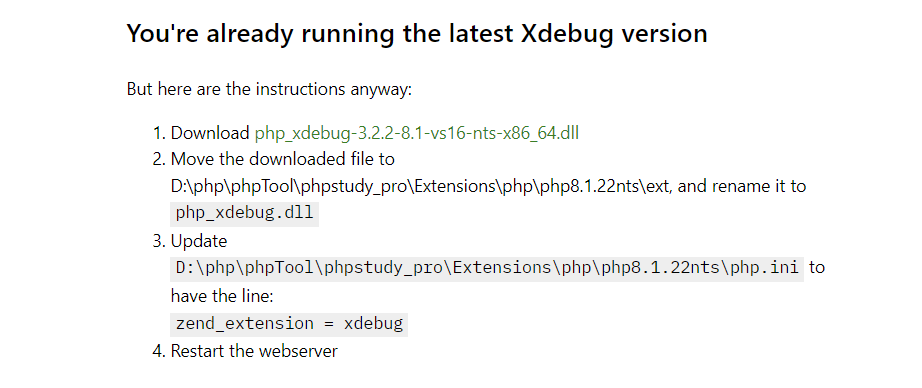
按照上面提示的步骤,把文件放在php\ext目录里面。
二、设置php.ini
打开php.ini文件,把xdebug的配置加进去
看安装的xdebug版本是多少,2和3有些不一样
XDEBUG 3
[Xdebug]zend_extension=D:/php目录/php7.3.4nts/ext/php_xdebug.dllxdebug.idekey="PHPSTORM" # 非常重要,务必记住;配置端口和监听的域名xdebug.mode=debugxdebug.discover_client_host=truexdebug.remote_cookie_expire_time = 3600xdebug.client_port=9010xdebug.client_host="localhost"xdebug.start_with_request=yesxdebug.remote_handler = "dbgp"
XDEBUG 2
;; debug2的
[Xdebug]
zend_extension=D:/php目录/php7.3.4nts/ext/php_xdebug.dllxdebug.trace_output_dir=D:/phpTool/phpstudy_pro/Extensions/php_log/php7.3.4nts.xdebug.tracexdebug.profiler_output_dir=D:/phpTool/phpstudy_pro/Extensions/php_log/php7.3.4nts.xdebug.profilerxdebug.profiler_append = 0xdebug.profiler_enable=Onxdebug.profiler_enable_trigger = 0;开启远程调试xdebug.remote_enable=On;客户机xdebug调试协议xdebug.remote_handler="dbgp"xdebug.remote_mode = "req"xdebug.remote_host=127.0.0.1;xdebug.remote_port修改默认值9000为9010(因为PHP-FPM默认监听9000端口,总是被占用),这里需要跟phpstorm配置一致xdebug.remote_port=9010;idekey 区分大小写xdebug.idekey="PHPSTORM"xdebug.collect_params=1xdebug.collect_return=1xdebug.auto_trace=On
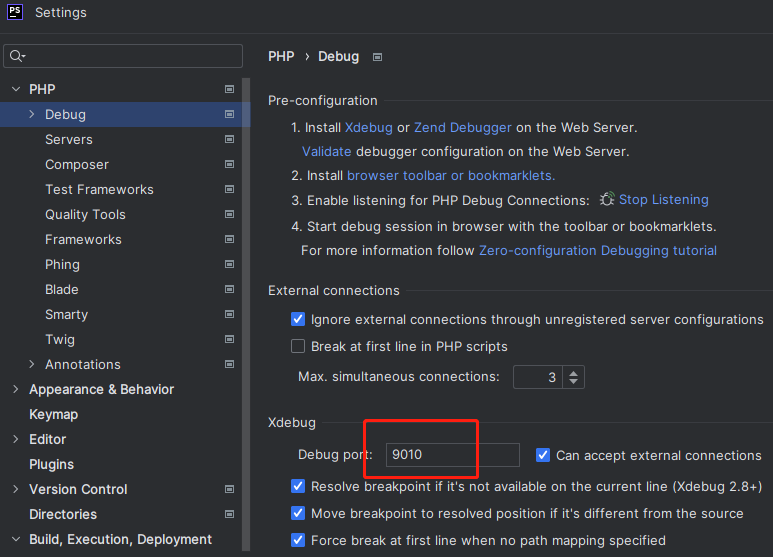
二、设置phpstorm
打开设置,File->Settings->PHP->Debug,填写php.ini中设置的端口号
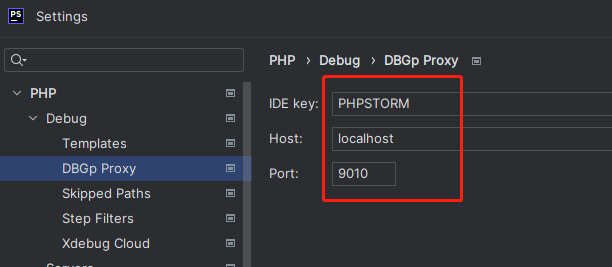
File->Settings->PHP->Debug->DBGp Proxy,填写php.ini中设置的内容
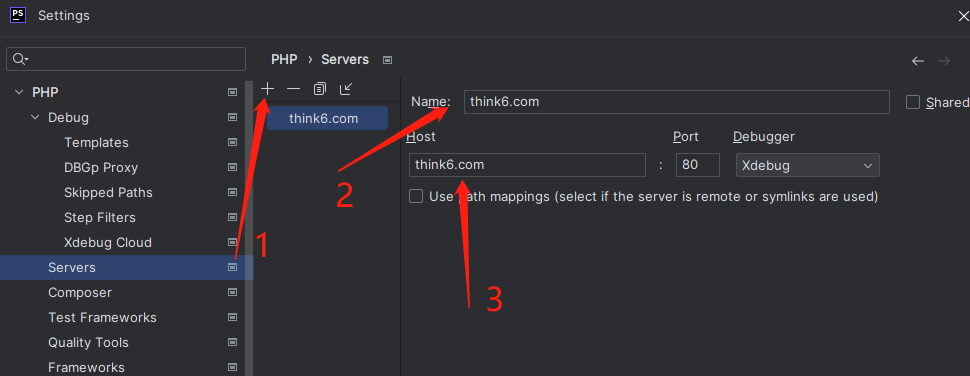
设置Servers,
Name起一个名字,Host填写本地host里配置的地址
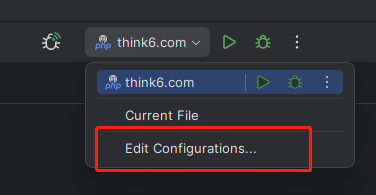
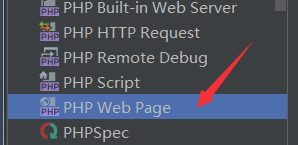
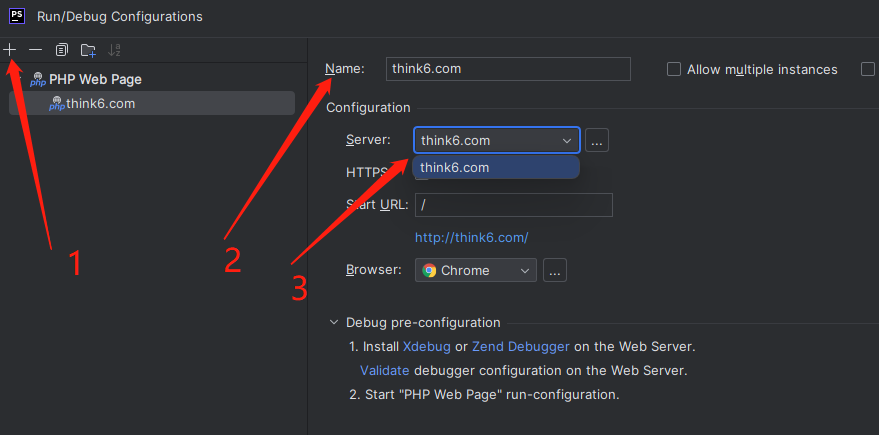
四、设置Run/Debug Configurations
编辑器右上角,选择Edit Configurations…
添加一个配置,
点击加号,
Name起一个名字,Server选择刚刚创建的Servers
Run勾选上Break at first line in PHP scripts
配置完成。
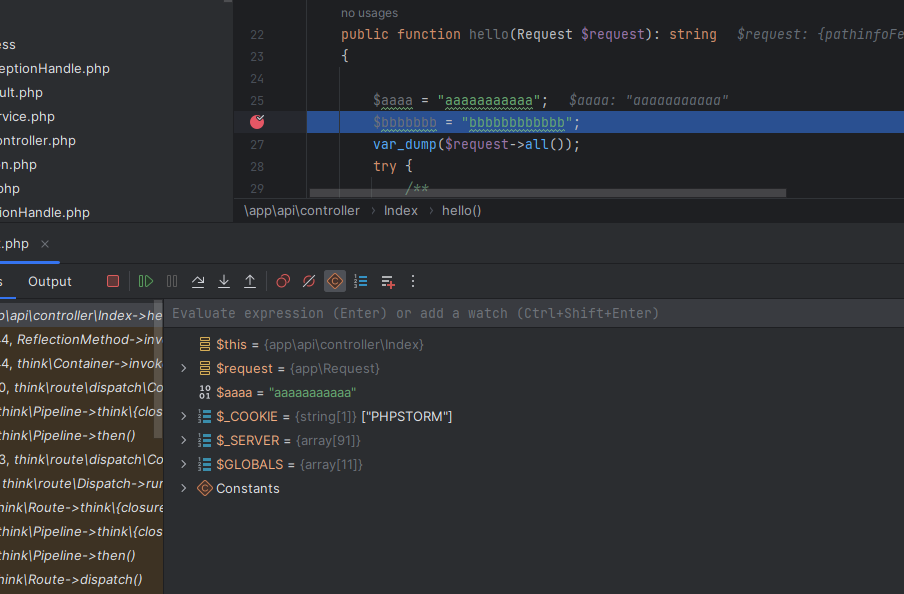
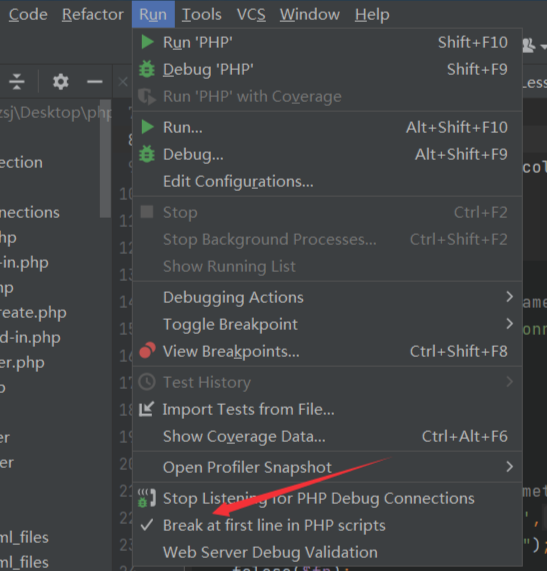
五、测试
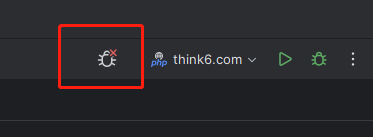
当用phpstorm进行debug调试的时候,记得开启监听模式
开启
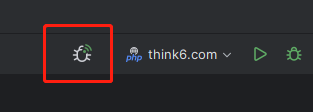
关闭
在编辑器里打上断点,请求一下接口